This function plots one heatmap (or two heatmaps) of the
metrics present in
a CNVMetric object. For the overlapping metrics, the user can select
to print the heatmap related to amplified or deleted regions or both. The
NA values present in the metric matrix are transformed into zero for
the creation of the heatmap.
Arguments
- metric
a
CNVMetricobject containing the metrics calculated bycalculateOverlapMetricor bycalculateLog2ratioMetric.- type
a single
characterstring indicating which graph to generate. This should be a type present in theCNVMetricobject or "ALL". This is useful for the overlapping metrics that have multiple types specified by the user. Default: "ALL".- colorRange
a
vectorof 2characterstring representing the 2 colors that will be assigned to the lowest (0) and highest value (1) in the heatmap. Default:c("white", "darkblue").- show_colnames
a
booleanspecifying if column names are be shown. Default:FALSE.- silent
a
booleanspecifying if the plot should not be drawn. Default:TRUE.- ...
further arguments passed to
pheatmap::pheatmap()method. Beware that thefilenameargument cannot be used whentypeis "ALL".
Value
a gtable object containing the heatmap(s) of the specified
metric(s).
See also
The default method pheatmap::pheatmap().
Examples
## Load required package to generate the samples
require(GenomicRanges)
## Create a GRangesList object with 3 samples
## The stand of the regions doesn't affect the calculation of the metric
demo <- GRangesList()
demo[["sample01"]] <- GRanges(seqnames="chr1",
ranges=IRanges(start=c(1905048, 4554832, 31686841),
end=c(2004603, 4577608, 31695808)), strand="*",
state=c("AMPLIFICATION", "AMPLIFICATION", "DELETION"))
demo[["sample02"]] <- GRanges(seqnames="chr1",
ranges=IRanges(start=c(1995066, 31611222, 31690000),
end=c(2204505, 31689898, 31895666)), strand=c("-", "+", "+"),
state=c("AMPLIFICATION", "AMPLIFICATION", "DELETION"))
## The amplified region in sample03 is a subset of the amplified regions
## in sample01
demo[["sample03"]] <- GRanges(seqnames="chr1",
ranges=IRanges(start=c(1906069, 4558838),
end=c(1909505, 4570601)), strand="*",
state=c("AMPLIFICATION", "DELETION"))
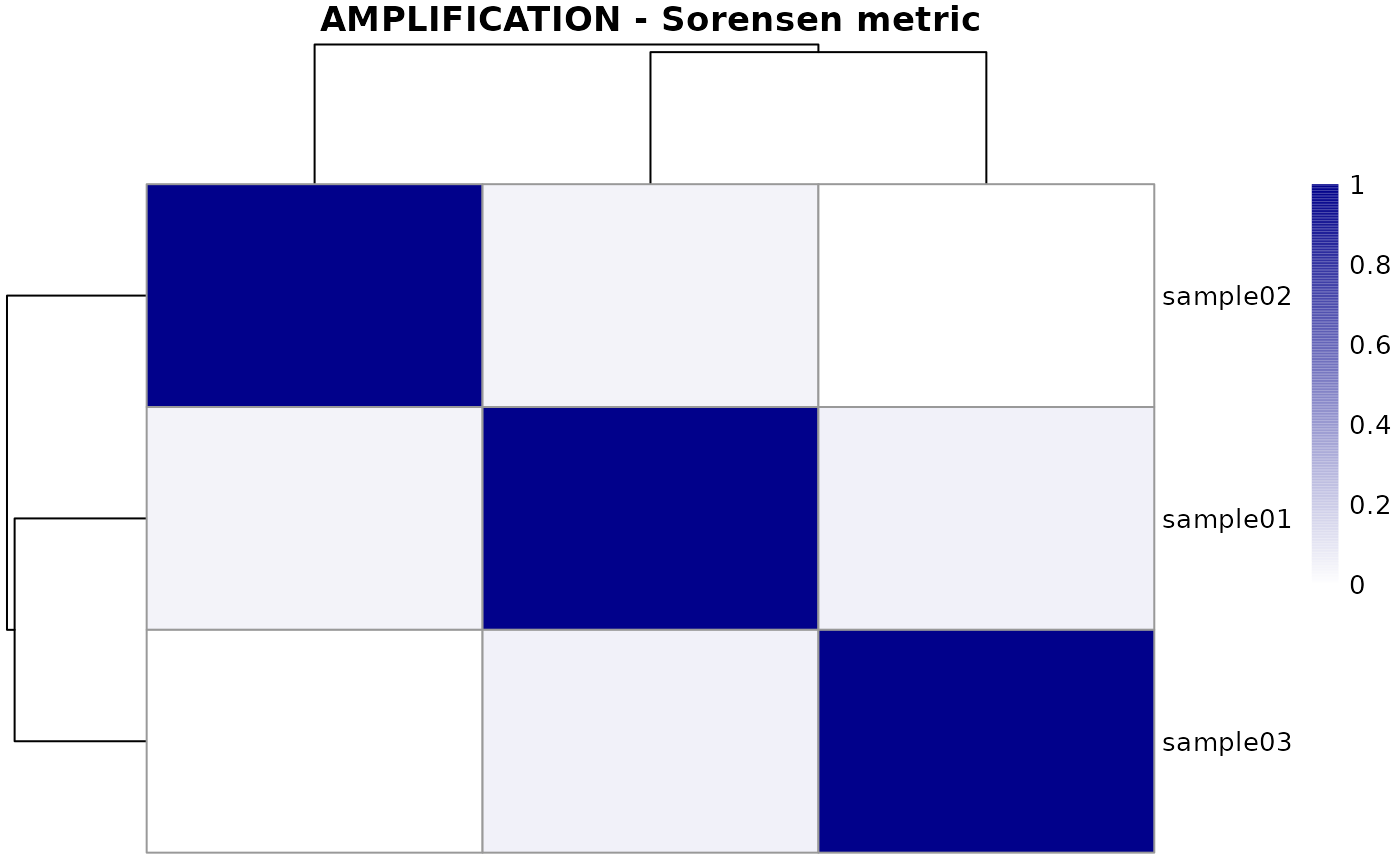
## Calculating Sorensen metric
metric <- calculateOverlapMetric(demo, method="sorensen")
## Plot both amplification and deletion metrics
plotMetric(metric, type="ALL")
 ## Extra parameters, used by pheatmap(), can also be passed to the function
## Here, we have the metric values print to the cell while the
## row names and column names are removed
plotMetric(metric, type="DELETION", show_rownames=FALSE,
show_colnames=FALSE, main="deletion", display_numbers=TRUE,
number_format="%.2f")
## Extra parameters, used by pheatmap(), can also be passed to the function
## Here, we have the metric values print to the cell while the
## row names and column names are removed
plotMetric(metric, type="DELETION", show_rownames=FALSE,
show_colnames=FALSE, main="deletion", display_numbers=TRUE,
number_format="%.2f")
